Has the reorganisation of Jammu and Kashmir fractured its statistical memory, making comparative research and performance evaluation extremely difficult, asks Dr Haseeb A Drabu
The abrogation of Article 370 and the bifurcation of the erstwhile state of Jammu and Kashmir into two Union Territories on October 31, 2019, marked one of the most significant administrative reorganisations in recent Indian history. While the political and developmental implications have been intensely debated, a quieter but equally consequential casualty has received far less attention: the rupture in long-term statistical continuity for the region.
This is not merely a technical inconvenience. It represents a genuine loss of institutional and epistemic memory: the capacity to track economic and social trajectories over extended periods with consistency. Pre-2019 data for Jammu and Kashmir included the Ladakh division. Post-2019 data for the Union Territory of Jammu and Kashmir excludes it. The geographic unit of analysis changed, and with it, the foundation for comparable time-series statistics was fractured.
If full statehood is restored around 2029, the intervening decade risks becoming, in statistical terms, a “lost decade”; not politically, but analytically.
The Break in the Series
Official statistics now explicitly record the discontinuity. The Comptroller and Auditor General’s report on UT Finances for 2023-24 notes the bifurcation and marks growth rates for 2019-20 as “Not Available” in key tables. The Annual Survey of Industries carries a footnote stating that data from 2019-20 onwards for Jammu and Kashmir “are not strictly comparable with previous year data since Jammu and Kashmir was bifurcated into two UTs viz. Jammu and Kashmir and Ladakh.” The Ministry of Statistics and Programme Implementation and the state’s Directorate of Economics and Statistics routinely append near-identical disclaimers to GSDP and related series.
Ladakh’s economic footprint was small, roughly 2-3% of the erstwhile state’s population, but the principle of continuity in national accounts requires consistent territorial boundaries. Removing even a small region alters base figures, shifts sectoral weights, and distorts growth arithmetic. Researchers attempting consistent long-run series must now either splice data with arbitrary adjustments or restrict analysis to short post-2019 windows. Both approaches introduce uncertainty.
Core Indicator Fractured
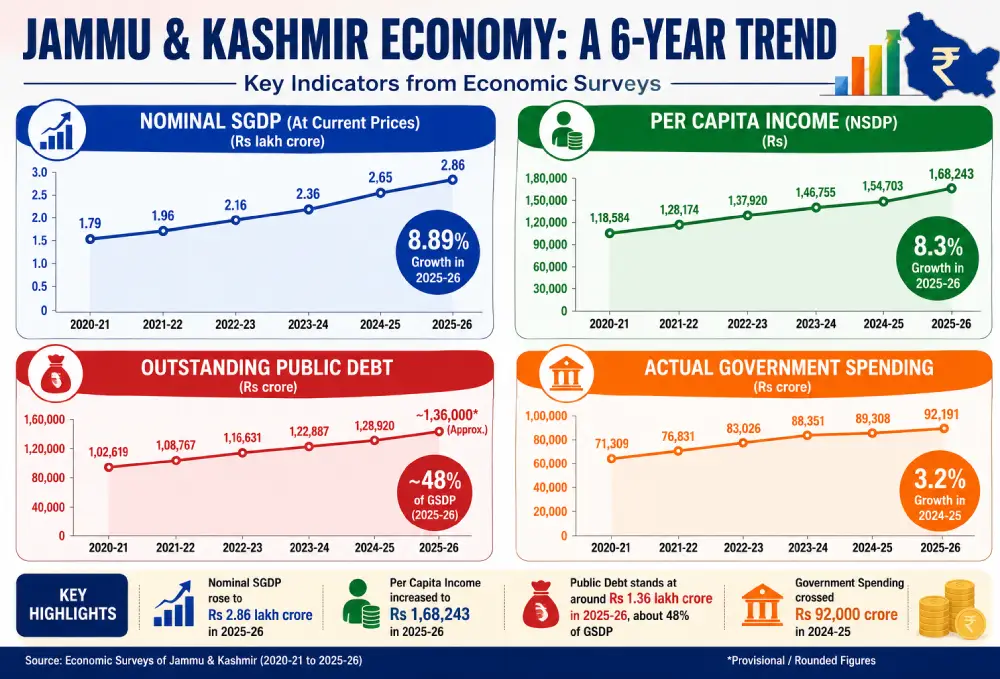
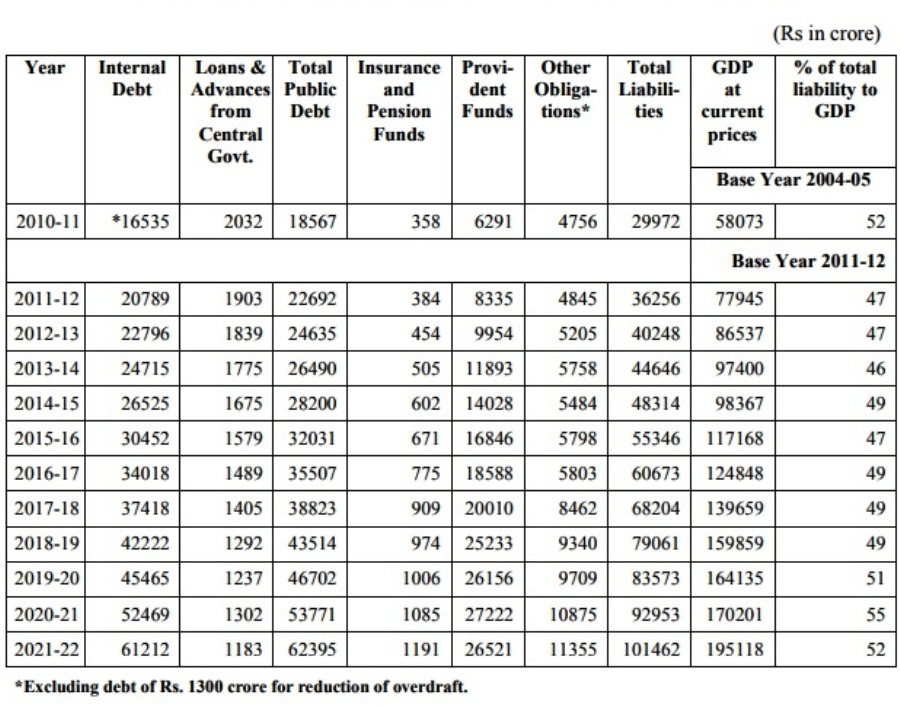
Gross State Domestic Product is the foundational variable for assessing economic size, growth, and structure and the fracture is most visible here. On the pre-2019 series (current prices, 2011-12 base), the erstwhile state reached approximately Rs 1,59,859 crore in 2018-19. Post-bifurcation, the UT of Jammu and Kashmir recorded Rs 1,64,103 crore in 2019-20, rising to Rs 2,36,059 crore by 2023-24. On paper the trajectory looks continuous; in reality, it splices two different geographic universes.
At constant (2011-12) prices the break is more consequential. The 2019-20 transition years carries no comparable growth figure in official compilations. Pre-2019 real growth averaged around 6-7% in the mid-2010s, while post-2019 averages dipped notably in 2019-21 before partial recovery. Nominal NSDP growth, for instance, averaged 13.28% between 2015 and 2019 but fell to 8.73% in the subsequent period.
Sectoral shares of agriculture, industry, services also shift marginally because Ladakh’s contribution, more heavily weighted toward certain primary and tourism-linked activities, disappears from both numerator and denominator simultaneously.
Proxies Under Strain
Per capita income, measured through NSDP per capita, is a central proxy for living standards. Official tables carry the bifurcation caveat. Figures show per capita GSDP/NSDP rising from around Rs 98,738 – 1,18,828 in 2018-19 to Rs 1,23,730 in 2019-20 and higher thereafter, but the series is not a pure continuation.
At constant prices, real per capita trends show volatility around the break year, compounded by the 2019 communications blackout. Long-term comparisons spanning 2011-12 to 2025 require researchers to make an explicit methodological choice about the Ladakh exclusion.
Household consumption data from the Household Consumption Expenditure Survey follows a parallel pattern. Pre-2019 rounds covered the full state; post-2019 rounds cover only the UT. Absolute MPCE numbers continue to be published, but the change in coverage introduces a small, systematic shift in both the population base and the economic geography sampled.
Broader welfare metrics like poverty estimates, consumption-based inequality (Gini), and employment data from the Periodic Labour Force Survey face analogous challenges for any multi-decade view.
The “Development Decade”
The period 2019-2029 was positioned as one of unprecedented focus on governance reform, infrastructure, investment, and integration. Central transfers as a share of GSDP reportedly rose, own-tax effort strengthened in some accounts, and capital expenditure increased. Yet the very data infrastructure needed to measure, verify, and learn from these changes was compromised at the outset.
If statehood returns in 2029, the incoming government and researchers will inherit two broken chains: a clean pre-2019 state series and a separate post-2019 UT series. Bridging them will require statistical splicing, back-casting, or parallel “old-boundary” estimates all of which reduce precision and invite methodological disputes. The decade meant to deliver memorable development risks being remembered, in statistical circles, as the decade whose data cannot be straightforwardly compared with its own history.
This is not a partisan observation. Every major reorganisation creates short-term discontinuities. What distinguishes the Jammu and Kashmir case is the scale of national attention on the region’s development narrative set against the relative silence on its statistical cost.
A Philosophical Loss of Memory
Beyond the numbers lies deeper erosion. Time-series analysis is how societies build cumulative knowledge: Did a policy work? How does the current shock compare with historical ones? What is the region’s structural growth rate? When the unit of analysis itself mutates mid-series, these questions become far harder to answer rigorously. Policymakers lose reliable benchmarks. Academics and journalists lose the ability to hold claims accountable against long-run evidence.
The Directorate of Economics and Statistics has added the necessary footnotes. What is missing is a more proactive effort: parallel historical series adjusted to current boundaries, detailed metadata on the Ladakh apportionment, or explicit methodological guidance for constructing consistent long-run indicators. Recognising the statistical cost of the 2019 reorganisation is the first step toward mitigating it. In an era that prizes evidence-based governance, the integrity of the data deserves at least as much attention as the policies it is meant to evaluate.
DES 1999–2019
That the 2019 break is felt so acutely is itself a tribute to how good the preceding system was. The Directorate of Economics and Statistics (DES), under the Planning Department, built a credible and functional statistical system across the two decades before 2019. Emerging from a modest Statistical Section in the 1950s and formally established as a Directorate in 1967-68, it expanded through regional offices, block-level units, and dedicated training schools. By the 1990s it had transformed an earlier weak database into a source of socio-economic information comparable in quality to many other Indian states.
The insurgency years took a heavy toll on data collection. Regular compilation of GSDP and per capita income estimates, aligned with central guidelines, was restored only around 2000. From there the DES went further, producing District Domestic Product estimates, then a relatively rare achievement, which enabled sharper understanding of regional disparities.
Dissemination was a particular strength. The annual Digest of Statistics, Pre-Budget Economic Survey, Indicators of Economic Development (introduced in 1983-84), Handbook of Statistics, and other regular publications together built a valuable historical record. The DES also served as the nodal agency for NSSO rounds, conducted Economic Censuses, compiled the Index of Industrial Production, maintained price and vital statistics, and ran training schools in Jammu and Srinagar. Despite the constraints of geography and conflict, it delivered the only reliable long-term statistical memory of Jammu and Kashmir’s economy and society.
Before the Republic
Before 1947, Jammu and Kashmir had no dedicated statistical department. Data collection was revenue-oriented and administrative. Under the Mughals, the Ain-i-Akbari recorded detailed provincial statistics on land area, revenue, crops, and villages. During the Dogra period (1846-1947), the focus remained on land revenue records maintained by patwaris and tehsildars. The first systematic census was conducted in 1891, followed by more detailed exercises in 1931 and 1941. British influence after 1885 brought gradual improvements, but the system remained decentralised, limited in scope, and oriented chiefly toward taxation.

A Robust System?
Judged overall, the robustness of Kashmir’s economic and social database has been moderate; better than one might expect given decades of conflict, but with real limitations in coverage, comparability, and long-run consistency.
The pre-2019 system was detailed enough for planning, inter-district comparison, and tracking of broad trends. Social indicators from NFHS rounds often compared favourably with national averages. However, conflict severely compromised data quality on the ground. A detailed study of NSSO surveys between 1973 and 2014 found substantial non-coverage in Jammu and Kashmir in some rounds up to 74% of the population, particularly in disturbed areas, went un-surveyed. This produced biased samples, overestimated consumption expenditure, and underestimated poverty.
The 2019 bifurcation added a second, distinct discontinuity. Official tables now carry routine non-comparability notes, transition-year growth rates are marked “Not Available,” and long time-series analysis demands explicit adjustment. The UT administration continues to publish Economic Surveys and district-level reports, but seamless historical comparison has become measurably more difficult.
Taken together, the economic database remains moderately robust at the aggregate and district level for GSDP and DDP, though survey-based components carry conflict-era coverage bias. The database supported broad policy insight and cross-sectional analysis but was never fully robust for precise long-term trend analysis or causal evaluation. It was a weakness insurgency created and the 2019 territorial break has compounded.
What Next?

The elected government should convene a small expert group comprising a data scientist, a policy planner, an economist, and ideally a couple of retired chiefs of the Directorate of Economics and Statistics. The mandate of this statistical commission should be to construct a one-time, methodologically transparent comparable database series on all key macroeconomic and sectoral variables.
The most defensible approach is to adjust the pre-2019 period to current territorial realities, adjust the past to the present, rather than leave researchers to adjust the present to the past. In the absence of such an effort, the “development decade” will remain, statistically, a decade that governance cannot fully evaluate against its own history.
(An economist, the author was Jammu and Kashmir state’s last finance minister.)